


The coronavirus pandemic continues to spread around the world. With a presence in 192 countries and territories, it continues to add infections and claim lives, although the beginning of vaccination has contributed to reducing the numbers in recent weeks.
So far, there are a total of 211,816,904 confirmed cases and 4,431,068 deaths, according to data from the Johns Hopkins University in the United States.
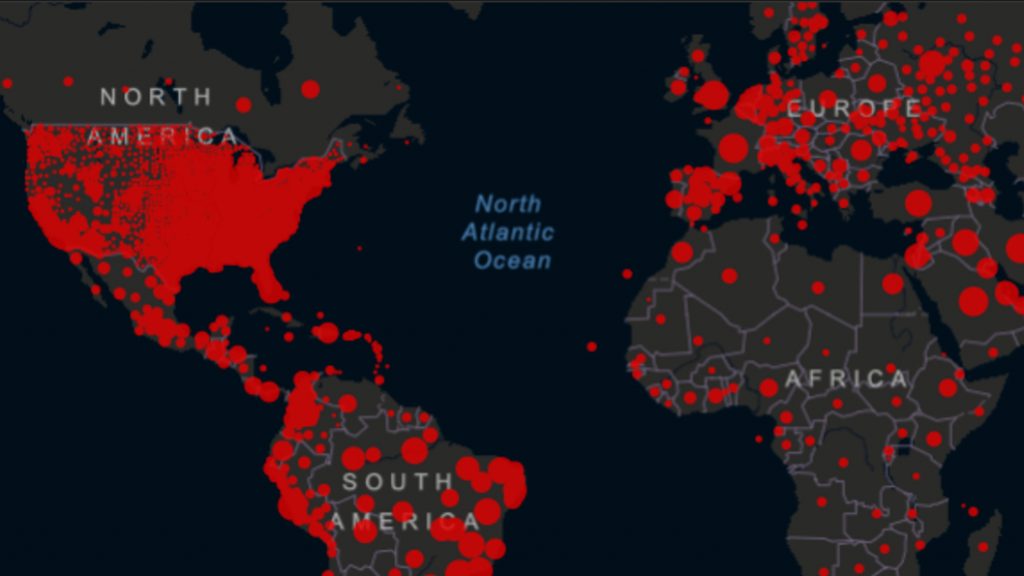
The American continent begins to see a decrease in cases, although the United States remains the country with the most cases and deaths, with a total of 37,709,810 infections and 628,503 deaths.
An impact like that of the coronavirus was not seen in almost a century and with death figures higher than those of the First World War. Given the need to collect the figures to measure the blow, different platforms have emerged in which the contagion figures on each continent can be followed in real time .
One of the best known and mentioned both on the internet and in the media is the Johns Hopkins University registry , which consists of having an interactive map in which you can have the number of infections, deaths and recovered from each country and its states in real time.
In case of having problems to visualize the map of the University you can enter this link.
You can also track the number of infections caused by the pandemic is the live broadcast on YouTube of RoyLab Stats.
It is the signal of a channel that has been broadcasting live and direct since January 30, 2020. In it you can see all the cases by country, ordered from highest to lowest depending on the number of infected and is perceived in the right part of the image. It should be noted that sometimes there are some discrepancies with the Hopkins University data, so we must clarify that the most accurate data are those provided by the World Health Organization (WHO).
On the left side of the screen, you can see a graphic map of the different ravages that COVID-19 has left around the world. The channel tunes live the press conference offered by the World Health Organization. These data serve as guidance only, since the main source that offers data with more extensive and detailed information is that provided by WHO.
When was the first case of coronavirus?
The coronavirus pandemic began in 2019, when the Wuhan Municipal Health Commission, China, reported that a group of 27 people had cases of unknown pneumonia, including seven serious cases. According to official government reports, the first case with symptoms on December 8, 2019, which included fever, dry cough, dyspnea, and heart and lung problems.
It was until January 7, 2020, that the Chinese health authorities identified the cause of the outbreak a new type of virus from the Coronaviridae family, which was later called SARS-CoV 2.
How is the coronavirus transmitted?
The coronavirus is transmitted by being in direct contact with the respiratory droplets that come from the cough or sneeze of a sick person. The contagion capacity depends on the virus level that a person has in the respiratory tract. These drops infect another person through the nose, eyes, or mouth directly.
What are the symptoms of the coronavirus?
Although the coronavirus affects people in different ways, common symptoms ranging from mild to moderate intensity have been recorded .
Usual symptoms: fever, dry cough and tiredness.
Less common symptoms: aches and pains, sore throat, diarrhea, conjunctivitis, headache, loss of sense of smell or taste.
Serious symptoms: Shortness of breath, shortness of breath, chest pain or pressure, inability to speak or move.
How many deaths are there in Mexico from coronavirus?
The contagion figures in Mexico have been increasing and, unfortunately, deaths from COVID-19 as well. A total of 253,155 deaths have been registered in Mexican territory .